Basics of Technical Analysis for Crypto Trading Explained Clearly

Grasping the foundational methods of crypto trading analysis is essential for any trader in the cryptocurrency market. Technical analysis, a prevalent method, involves examining statistical trends over time to predict future asset price movements based on historical trading data. This analytical approach is not limited to cryptocurrencies but also applies to stocks, futures, commodities, and currencies.
Technical analysis aims to identify bullish and bearish price movements, enabling traders to make more informed decisions. Although identifying these trends can be complex, it allows traders to capitalize on opportunities, such as purchasing assets during a bearish secondary trend within an overall bullish primary trend. Recognizing the optimal moment to buy or sell is critical, and understanding candlestick charts, support and resistance levels, moving averages, and other technical indicators become indispensable. These tools provide insights into market sentiment and potential price movements, guiding traders through the volatile landscape of cryptocurrency trading.
Fundamentals of Technical Analysis
Understanding the basics of technical analysis is crucial for traders to interpret market dynamics and forecast the price trajectories of cryptocurrencies. This analysis involves examining historical price data and trading volumes to identify patterns and trends that may indicate future price movements. The practice of technical analysis dates back to Charles Dow, whose pioneering Dow Theory laid the foundation for the sophisticated array of analytical techniques used today. Technical analysis operates on the principle that market prices inherently reflect all available information, suggesting that the current price indicates an asset’s intrinsic value.
Technical analysts rely heavily on charting tools and patterns to identify potential buying and selling points. Recognizing bullish and bearish trends, which respectively indicate upward and downward price movements driven by market sentiment, is among the most critical aspects of this analysis. Candlestick charts enhance the analytical process by providing a visual representation of price fluctuations within specific time frames, enabling traders to identify trends and reversals.
Furthermore, applying support and resistance levels through trendlines helps pinpoint strategic entry and exit points in the market. These levels are crucial as they indicate concentrated buying or selling interest, making it challenging for prices to move beyond these thresholds without significant market momentum.
Moving averages also play a vital role in technical analysis by smoothing out price fluctuations over time, thereby highlighting underlying trends. By observing the interaction between short-term and long-term moving averages, such as the 50-day and 200-day, traders can identify significant market signals like the “death cross” or “golden cross.” These signals often indicate market downturns or upswings respectively.
While technical analysis is a powerful tool, it is not infallible. It is most effective when used in conjunction with other methods, such as fundamental analysis, to provide a more comprehensive view of the market. By mastering these analytical techniques, traders can enhance their ability to make strategic decisions in the fast-paced and often unpredictable crypto market.
Comparison of Technical and Fundamental Analysis
Technical and fundamental analysis both play crucial roles in the prediction of future stock price trends, yet they adopt distinct methodologies, attracting varied followings and criticisms.
Fundamental analysis thoroughly assesses securities to determine their intrinsic value. This approach entails a detailed investigation encompassing macroeconomic indicators, sector trends, and the detailed financial condition and governance of a company. Fundamental analysts focus on crucial financial metrics such as earnings, expenses, assets, and liabilities.
Conversely, technical analysis primarily examines the price and volume of stocks, placing less emphasis on the granular fundamentals. Proponents of this method believe that current stock prices integrate all existing fundamental data. Technical analysts utilize charts to identify patterns and trends to predict future price movements.
Interpretation of Trading Charts
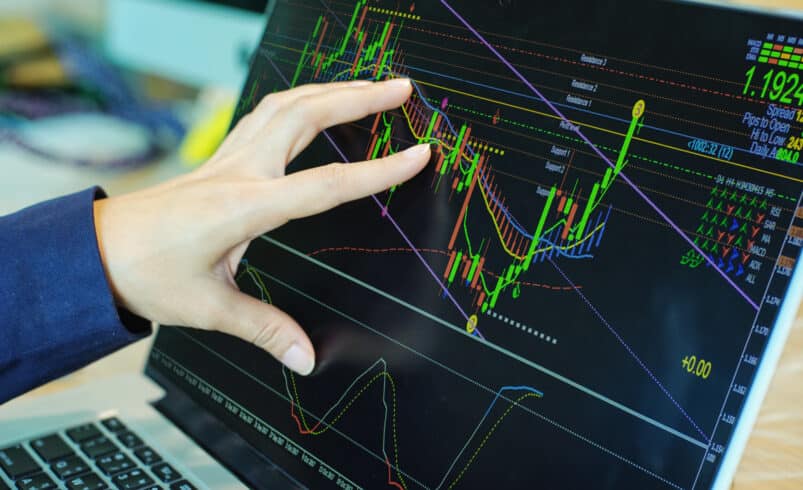
The interpretation of trading charts is a fundamental component of technical analysis, enabling traders to make well-informed decisions in the cryptocurrency market. This analysis involves a meticulous review of historical trading data to detect patterns that help forecast future price shifts. Candlestick charts are particularly beneficial in this context as they provide a detailed depiction of market behavior over specific periods. The appearance of the candlesticks indicates the nature and extent of price changes, which is essential for gauging market sentiment.
A critical element in chart interpretation is the identification of support and resistance levels through trendlines. These levels represent points of intense buying or selling pressure that can stall price movements, posing challenges for price advancement without substantial market force. Traders typically buy at support levels and sell at resistance to maximize market movements.
Moreover, moving averages help smooth out price data to reveal clearer trends. Specific averages, like the 200-day moving average, serve as key markers of market support or resistance. The intersection of different moving averages may indicate significant shifts in the market.
Final Thoughts
While technical analysis provides significant insights, it should only be relied upon partially. Traders are advised to use it in conjunction with other analytical methods, such as fundamental analysis, to gain a comprehensive understanding of market conditions. Mastery of trading chart interpretation can significantly improve traders’ ability to predict market movements and tailor their trading strategies accordingly.
DISCLAIMER: It's essential to understand that the articles on this site are not meant to serve as, nor should it be construed as, advice in legal, tax, investment, financial, or any other professional context. You should only invest an amount that you are prepared to lose, and it's advisable to consult with an independent financial expert if you're uncertain. To obtain more information, kindly examine the terms of service and the assistance and support resources made available by the issuing or advertising entity. Our website is committed to delivering accurate and unbiased news, yet it's important to note that market conditions may change rapidly. Also, be aware that some (but not all) articles on our site are compensated or sponsored.


